Get in touch with Suzhou Simitch Machinery Co., Ltd Company

How to Measure Force: Force Measurement Units, Force Meters, Load Cells, and Force Measuring Instruments


For physics and mechanical engineering, how you measure force refers to quantifying a physical push or pull interaction between bodies. Because force isn’t a physical substance you can hold, instruments never read force in isolation. Pushes and pulls are counter-balanced against known gravitational or electromagnetic forces. Otherwise, users measure a reversible physical effect, such as elastic deformation, strain, or charge, in a calibrated sensing element.
Shop-floor teams generate a lot of scrap when they assume absolute truth in any digital readout. Reading a hydraulic line gauge or a motor current trace doesn’t tell us the real load reaching the workpiece. Even a direct 10 kHz load cell near the tooling remains affected by moving fixture mass inertia and damping between the sensor and workpiece during rapid impact. This guide covers force units, nine instrument and estimation categories, calibration standards, and inline press-fit monitoring.
Key Engineering Takeaways
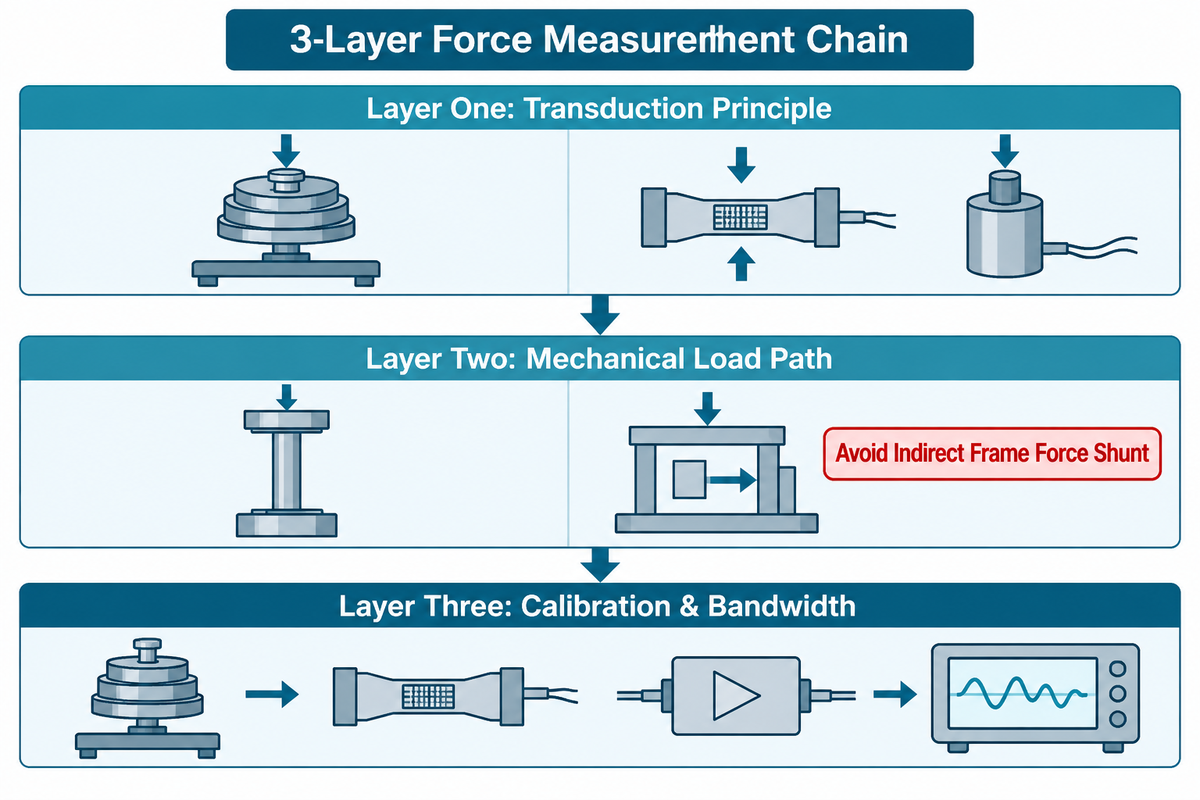
- Structure every force testing arrangement around the 3-Layer Force Measurement Chain: the transduction physics, the path of mechanical load, and traceable calibration with matched signal bandwidth.
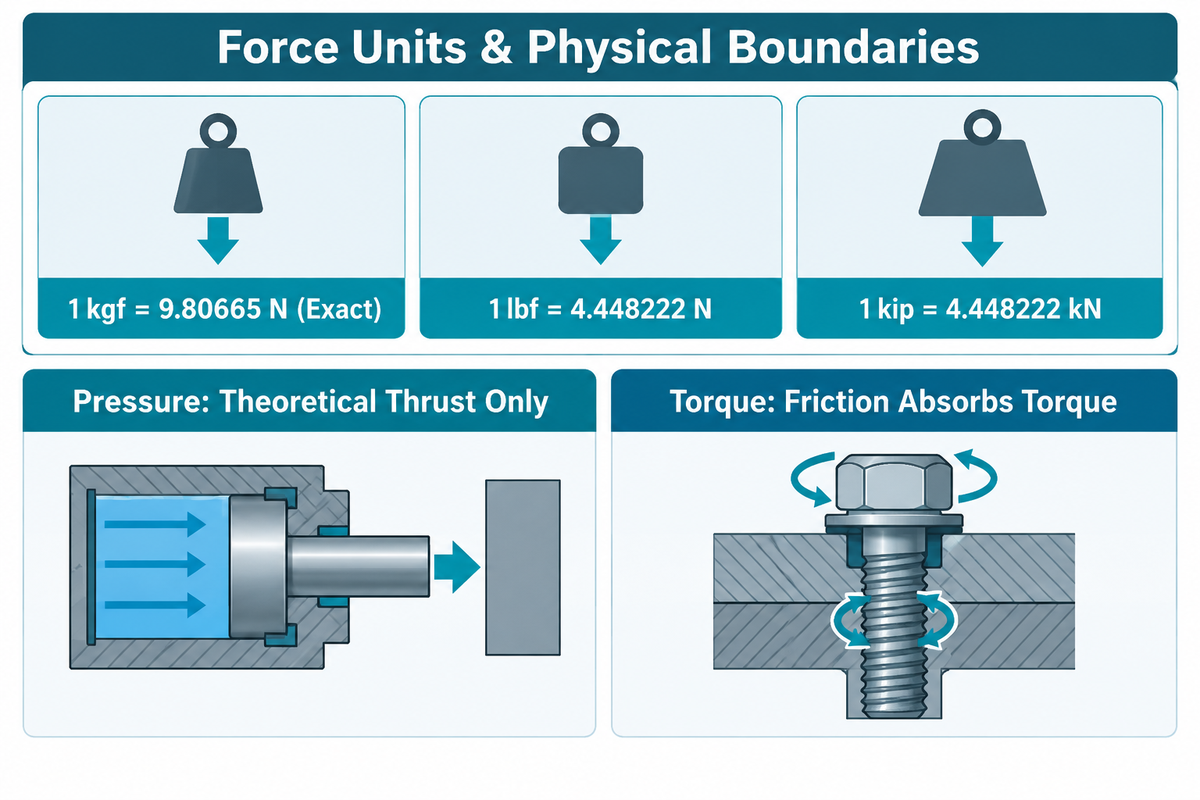
- According to the UK National Physical Laboratory (NPL), one kilogram-force equals 9.80665 N exactly and one pound-force equals 4.448222 N. Pressure is force per unit area (multiplying cylinder pressure by piston area ignores seal friction and rod side-load losses). Torque is rotational moment, where thread and under-head friction obscure axial bolt clamp tension.
- Match sensor physics to load duration. HBK’s manufacturer comparison reports creep below 200 ppm of the measured value for strain-gauge sensors such as the HBM S2M, under specified load, time, and temperature conditions. In the same comparison, the piezoelectric sensor and charge amplifier chain drifts at about 1 N/min of equivalent force after warm-up. Quartz piezoelectric sensors are suited to high-speed impacts and require mechanical preloading that exceeds tensile unloading components in cyclic service.
- Separate reference transducer standards (ISO 376:2011 and ASTM E74) from installed machine verification standards (ASTM E4-24 and ISO 7500-1:2018), with both ISO standards confirmed active in 2026. ASTM E4-24 Scope 1.6 states that a typical +/- 1% of reading is allowable machine indication error without subtracting calibration measurement uncertainty. Also ISO 7500-1:2018 states that in high-speed dynamic testing, static force calibration values are not automatically valid.
How Do You Measure Force? Direct Balance vs. Deformation Principles
To measure force in a laboratory or factory, you either balance the load against a known reference or track its physical effect. Primary standards laboratories use deadweight machines that hang known masses in a local gravity field. According to the second law of Newton, the force exerted on a free mass is equal to mass times acceleration. In high-precision balances, an unknown load is balanced with an opposing electromagnetic coil.
Factory test stands and assembly presses rarely have room for deadweight stacks. Strain-gauge load cells use a metal sensing element whose elastic strain tracks applied force, while piezoelectric sensors generate charge when their crystals are mechanically stressed. Bonded foil bridges convert metal micro-strain to a differential voltage, and stressed quartz crystals create an electrostatic charge signal for a charge amplifier. Here, force measurement is essential for verifying structural safety and joint integrity across production batches.
We evaluate any force-sensing station through the 3-Layer Force Measurement Chain, an editorial engineering framework rather than an industry standard. Layer one is the transduction principle, which sets static zero stability and dynamic frequency response. Layer two is the mechanical load path, which covers the axial alignment and base flatness, as well as the parasitic shunt paths. Layer three is the traceability of calibration and the signal bandwidth. This connects the sensing element to the amplifier and readout.
As noted in the NIST Force Calibration Laboratory documentation, strain gauge load cells and mechanical proving rings are calibrated against deadweight primary standards. According to Alluris technical documentation, mounting a sensor on a press frame creates an indirect force shunt. Frame deflection isn’t strictly linear within the load range. Therefore, a force-shunt sensor can’t be independently linearized from the machine structure.
Units Used to Measure Force: Newtons, lbf, kgf, and Force vs. Pressure
For the International System of Units, newton (N) is the derived SI unit for force. One newton is the force needed to accelerate a mass of one kilogram at one meter per second squared. Heavy structural testing and press-fit assembly normally record peak loads in kilonewtons (1 kN = 1,000 N). Precision micro-switch and medical catheter tests often work in millinewtons (1 mN = 0.001 N).
Drawings from North American and legacy European plants still specify imperial or gravitational units. The National Physical Laboratory (NPL) guide to the SI unit of force publishes exact and seven-significant-figure conversion factors. One kilogram-force (kgf, or kilopond kp) equals 9.80665 N exactly, and one metric ton-force equals 9.80665 kN. For Imperial units, one pound-force (lbf) equals 4.448222 N. Likewise, one kip (1,000 lbf) is 4.448222 kN and one US short ton-force (2,000 lbf) is 8.896443 kN.
Shop drawings often confuse mass (lbm or kg) with weight, and mix up axial force with fluid pressure or fastener torque. Pressure is a scalar quantity equal to force per unit area (pascals, bar, or psi). As Interface’s engineering guide on force versus pressure explains, multiplying cylinder fluid pressure by piston area only yields theoretical thrust. Cylinder seal drag, side-loading of the rod, and shifts in temperature of the oil consume a significant portion of that thrust before the ram makes contact with the part.
In pneumohydraulic drive cylinders for pressing, regulators control supply-air pressure and pressure gauges measure circuit pressure. Neither directly measures the final load at the workpiece. The same trap applies to technicians using wrench torque to calculate bolt clamp load. Friction at the threads and underside of the head consumes much of the tightening torque. Thus, torque doesn’t provide an accurate estimation of clamp load. Controlled friction, angle-controlled tightening, and bolt-elongation or direct-force measurements can improve preload control. For threaded joints, use separate measurement units for force and torque specifications on quality control sheets.
Types of Force in Testing: Tension, Compression Force, Shear, and Dynamic Impact

Mechanical test protocols classify loads by vector direction and velocity before designating any transducer. Principal types of force in industrial testing include axial tension, axial compression, in-plane shear, peel or bend loading and high-speed dynamic impacts. Each of these modes stresses testing elements and fixtures differently. Thus, a transducer that’s only calibrated for compression shouldn’t be used for tension without independent verification in tension.
In a tensile pull test, grips stretch a wire terminal, weld coupon, or adhesive lap joint until yield or fracture. A compression force test can use flat platens to load a coil spring, bearing or sheet stack to assess stiffness or seating depth. In indentation hardness testing, an indenter presses into a specimen under a prescribed force and loading sequence. Morehouse developed the original proving ring to improve Brinell hardness machine calibration. Shear and bend fixtures evaluate how fasteners, disc brake pads, and brackets resist sliding or flexural failure to confirm overall strength and durability.
Cyclic fatigue programs that alternate between tension and compression through zero demand special mechanical hardware. According to Interface’s cycle-testing engineering guide, fatigue-rated shear-web pancake load cells are rated for 100 million fully reversed cycles and use preloaded jam nuts. These nuts lock out thread backlash. Without tight preload, thread clearance hammers the sensing threads each time the load crosses zero. High speed impact events also excite structural resonances. These are also documented in the NASA technical report NTRS 19950022058 on dynamic impact force modeling.
When engineers compare mechanical metal joining methods such as clinching, self-piercing riveting, and structural bolting, joint geometry dictates the test mode. Sheet-metal joints typically undergo single-lap shear and cross-tension pull tests to verify interlock strength.
Force Measuring Instruments Compared: From Newton Meters to Load Cells
No single transducer covers every accuracy class, environment, and pulse duration. Selecting a force measuring device is a compromise between static zero stability and dynamic stiffness and integration cost. A simple spring balance or newton meter suits classroom demonstrations. Automated manufacturing force monitoring uses strain gauge load cells or piezoelectric sensors with signal conditioning. Across research and development laboratories, force measurement is used to validate component safety margins before tooling release.
In many plants, a benchtop dynamometer or universal frame houses these sensors for incoming inspection. The NIST Journal of Research publication on force laboratory instrumentation details how primary facilities excite and read precision bridge transducers. Morehouse’s technical comparison of proving rings and load cells states that mechanical proving rings provide better long-term geometry stability. Temperature-compensated master load cells, by contrast, deliver lower uncertainty and digital logging. Across aerospace airframes, automotive lines and medical devices, engineers match nine core instrument and estimation categories to the job.
| Instrument Category | Transduction Physics | Static Hold Stability | Dynamic Impact Capture | Primary Engineering Use and Limitation Boundary |
|---|---|---|---|---|
| Mechanical spring balance (Newton meter) | Helical coil spring extension under Hooke’s law | Moderate (subject to spring creep and parallax) | Not suitable (no electronic peak capture) | Basic teaching and unpowered field checks; coarse resolution and no digital data output |
| Analog dial push-pull gauge | Calibrated spring strip driving geared pointer with peak hand | Acceptable for shop spot-checks | Low-speed mechanical peak pointer only | Simple bench checks without electrical power; prone to gear wear and viewing parallax |
| Handheld digital force gauge | Internal strain-gauge beam with onboard ADC and screen | Good for short-duration checks | Low-to-medium (limited by ADC and filter bandwidth) | Connector pull-off, peel, and switch actuation checks; reduces hand-held off-axis errors when mounted on a test stand |
| Strain-gauge load cell | Elastic metal body with 4-arm Wheatstone foil bridge | Excellent (HBK reports creep below 200 ppm of measured value on HBM S2M under specified load, time, and temperature) | Medium quasi-static to moderate dynamic | Testing machines, industrial scales, and press-fit control; requires external signal conditioning and off-axis protection |
| Piezoelectric force sensor | Quartz crystal electrostatic charge under stress | Poor for long holds (~1 N/min force-equivalent zero drift in HBK’s compared chain; depends on sensitivity, insulation, and amplifier) | Excellent (ultra-high stiffness and kHz natural frequency) | High-speed stamping, crash testing, and ultrasonic or clinching transients; cannot hold pure static loads indefinitely |
| Hydraulic load cell | Sealed fluid capsule coupled to pressure indicator | Good (immune to electrical power loss) | Low (fluid inertia and gauge damping) | Outdoor piling, harsh washdown, and lightning-exposed heavy weighing; sensitive to ambient temperature shifts |
| Thin-film force-sensing resistor (FSR) | Conductive polymer film contact resistance shift | Low without specialized compensation (creep and hysteresis) | Qualitative trigger or contact mapping | Gripper part-presence detection and pressure distribution mapping; uncompensated units aren’t suitable for traceable metrology |
| Elastic proving ring | Precision alloy ring diametral deflection with micrometer reed | Excellent (mechanical transfer standard) | Static stepped loading only | Calibration laboratory force transfer; manual reed reading is slow and unsuitable for automated production |
| Servo motor-current estimator | Drive quadrature current multiplied by torque/lead constants | Fair (drifts with screw lube and thermal friction) | Distorted by rotor and leadscrew acceleration inertia | Coarse overload protection; mechanical friction variations mask fine press-fit or riveting defects |
Note on thin-film force-sensing resistors: peer-reviewed lab studies show that conditioning a polymer film and applying nonlinear history compensation improves repeatability. Without that custom calibration, standard commercial FSRs remain qualitative contact indicators. Industrial sensors are priced according to capacity, environmental sealing, and calibration class, with manufacturers quoting for the specific application.
Mechanical Spring Scales vs. Digital Force Gauges for Shop-Floor Testing
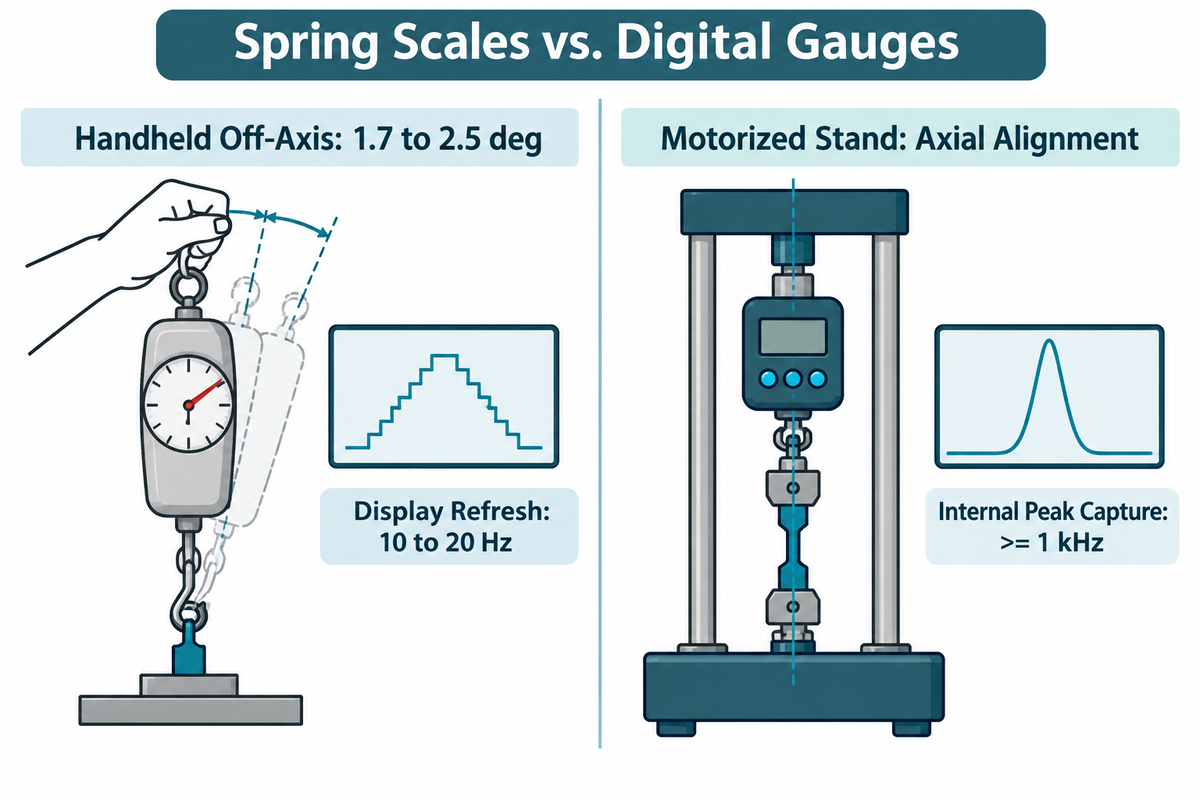
Walk onto an electronics or packaging floor and you’ll see both mechanical push-pull dials and digital gauges. Mechanical spring scales, which require no batteries or warm-up time, are good for quick go/no-go checks in remote yards. However, friction in the coil, parallax of the pointer and fatigue in the spring limit repeatability. When an audit requires timestamped records, operators switch to a handheld digital tester with an LCD display and a USB or RS-232 output.
In a digital gauge with a strain-gauge sensor, an internal A/D converter typically samples the bridge signal at a much higher rate than the screen refreshes. A screen might update 10 to 20 times per second so human eyes can read it. However, the internal peak detector can sample at 1 kHz or higher. It’s able to catch breaks in brittle materials. As Assembly Magazine’s report on force and torque sensors highlights, upgrading from manual feel to digital peak capture removes operator guesswork during end-of-line quality control.
Why Should a Force Gauge Be Used With a Test Stand?
An accurately aligned test stand minimizes off-axis loading, and controlled, motorized motion reduces the variability in operator speed. Peer-reviewed ergonomics research published in Applied Ergonomics (Ohio State University Spine Research Institute, 2020) examined manual push-pull exertion. It reported average vertical off-axis pulling angles of 1.7 to 2.5 degrees with a handheld uniaxial force gauge and 3.4 degrees during natural pulling. Turning tasks can also produce off-axis force. A rigid stand aligns each grip accessory along the measurement axis, making testing methods repeatable across shifts.
Strain-Gauge Load Cells: How Wheatstone Bridges Measure Tension and Compression
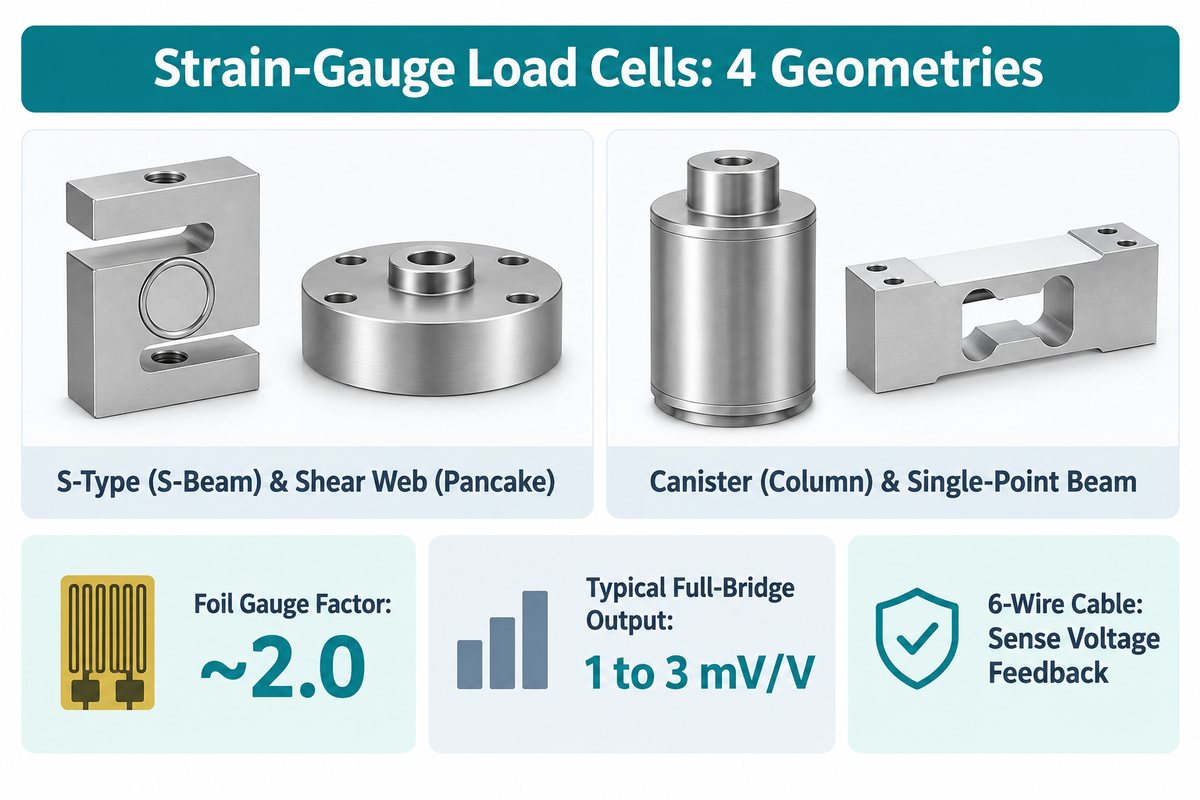
Force-induced shifts in electrical resistance are measured with strain gauges in load cells (full-bridge Wheatstone bridge). They are commonly used across industrial weighing, universal testing frames, and servo assembly presses. Each transducer has a flexure machined from a high-strength steel, stainless steel, or aluminum alloy billet that concentrates strain in thin webs. Gauges are bonded to the front and back of the flexure, and when the flexure is loaded, the gauges also flex, maintaining their contact with the loaded surface. The contact, in turn, changes the resistance of the gauges in direct proportion to the surface strain.
According to Micro-Tess’s Wheatstone Bridge load cell guide, a standard metal-foil strain gauge has a gauge factor of approximately 2.0. Industrial full-bridge load cells typically provide a rated full-scale output of 1 mV/V to 3 mV/V of excitation voltage. In a peer-reviewed design study (NIH PMC9571206, 2022), an axial load cell designed for a 300 N capacity, made of 6061 aluminum alloy with a 20 g mass, was studied. Researchers tested it with loads up to 30 kg, where 300 N corresponds to approximately 30.59 kg under standard Earth gravity. The study reports an amplified voltage-per-force sensitivity of roughly 15 mV/N at an instrumentation amplifier gain of 2001 and an excitation-normalized output of 446.8 uV/V at the maximum test load. A full bridge senses tension and compression in its arms, cancels out common-mode thermal expansion, and doubles signal sensitivity compared with a half bridge.
Mechanical body geometry determines a load cell’s ability to withstand shop-floor side loads:
- S-type (S-beam) load cells are compact and inexpensive for suspended tank weighing or tensile wire testing. However, their slender vertical arms are sensitive to bending moments and off-center loading.
- Radially symmetric shear web (pancake) load cells are favored for inline press-fit and riveting stations, owing to their symmetry which resists lateral forces, bending moments, and torque.
- Canister (column) load cells are high-capacity compression cylinders built for heavy structural frames, weighbridges, and multi-hundred-kilonewton presses.
- Single-point bending beams use corner-trimmed flexures found in off-center platform scales used in packaging and in health care dosing equipment.
Long cable runs between a press frame and a control cabinet drop excitation voltage as copper wire warms up. Six-wire load cell cables solve this problem by adding two sense wires that feed the actual bridge voltage back to the amplifier regulator.
What Is the Difference Between a Force Gauge and a Load Cell?
An electronic load cell converts force into an electrical signal for external measurement. An electronic load cell converts force into an electrical signal, while a handheld digital force gauge typically integrates a load cell, amplifier, digital readout and battery in the same case. Bare load cells are used along with an external PLC or data acquisition cards for automated machines. Handheld force gauges are used for shop floor inspections.
Piezoelectric, Hydraulic, and Thin-Film Sensors for Dynamic Force Measurement
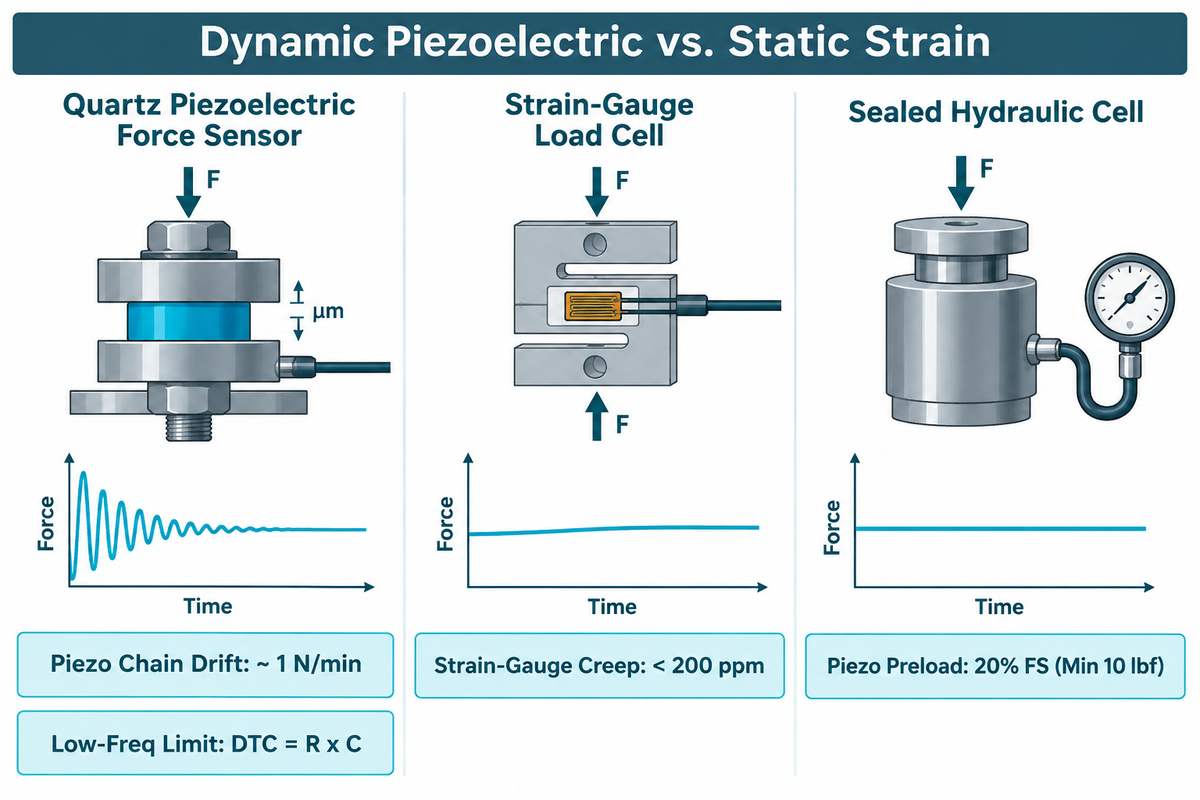
Impacts and collisions happen in milliseconds. If a transducer flexes too much during load, its own mass and compliance lower the mechanical natural frequency of the test rig. This compliance clips the true force peak. Quartz piezoelectric force sensors solve this problem with extreme stiffness. Because quartz crystals generate an electrostatic charge with only micrometer-scale deflection, they barely soften the machine load path.
Piezoelectric technology, however, has a strict low-frequency and static boundary. In HBK’s technical comparison of piezoelectric and strain gauge transducers, roughly 1 N/min zero drift is reported after warm-up for the piezoelectric measurement chain discussed. Force-equivalent drift is the charge drift divided by the sensor’s charge sensitivity. That drift is independent of the measured force magnitude. If a researcher zeroes a high-capacity piezoelectric ring to measure a small force over several minutes, the relative error balloons quickly. By contrast, strain-gauge transducers such as the HBM S2M hold creep below 200 ppm of the measured value.
PCB Piezotronics’ introduction to quartz force sensors states that low-frequency response is governed by the discharge time constant (DTC = R x C) of the sensor and charge amplifier. PCB specifies a preload of 20% of the force ring’s full-scale operating range, with a minimum of 10 lbf, and anti-friction washers in their installation guidance, cited here. For any tension or cyclic link, the preload must also exceed the working tensile unloading component. As ISO 7500-1:2018 (confirmed in 2026) states, static force calibration values are not automatically valid for high-speed or dynamic testing. Damping and mass of a moving fixture affect dynamic force transmission.
Where outdoor construction rigs or marine winches face lightning and washdown without power, sealed hydraulic load cells provide reliable low-frequency readout. However, teams often develop new products in robotics or aerospace propulsion, such as spacecraft propulsion thrust stands or internal combustion engine cylinder pressure rigs. In such test cells, engineers pair high-natural-frequency quartz sensors for transients with strain gauge cells for steady thrust.
How to Select Force Measurement Capacity, Sampling Rate, and Mounting Geometry
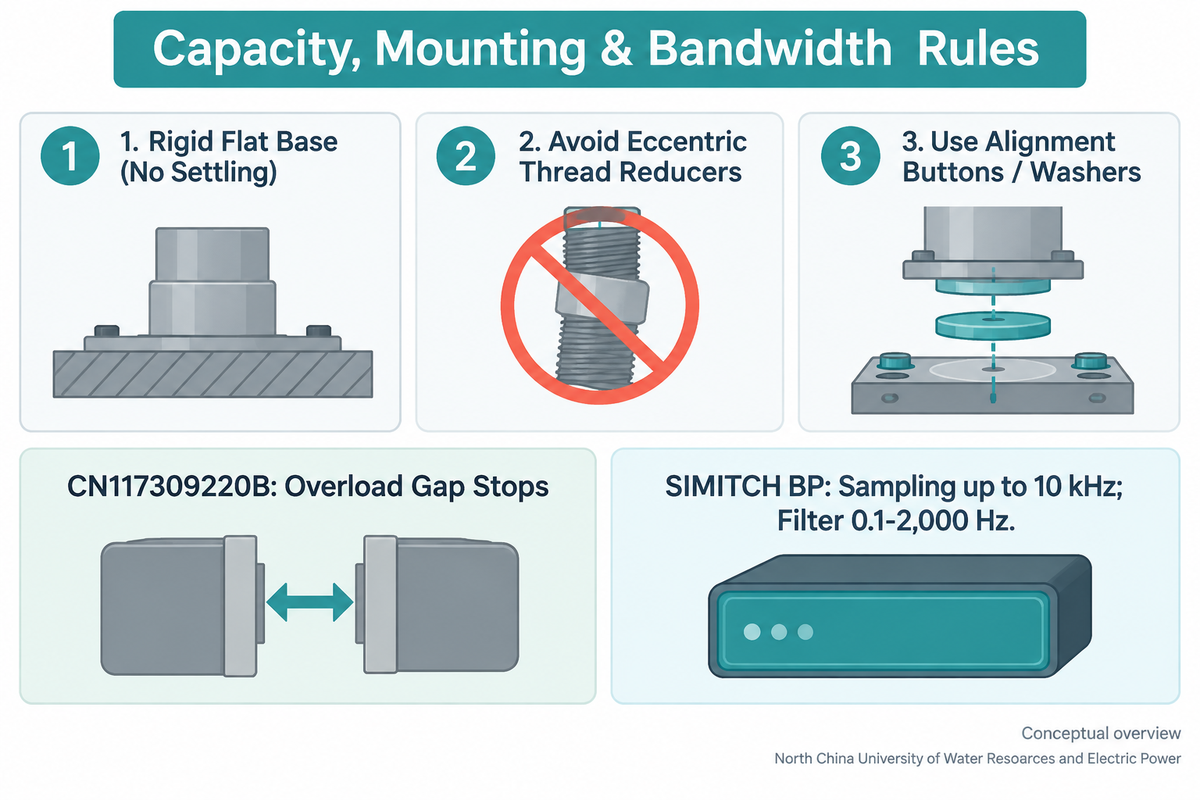
Select force transducer capacity with sufficient headroom above combined static tare weight and dynamic impact peak while keeping minimum test loads above the verified ISO 376 or ASTM E74 lower limit. Match the sampling rate and anti-aliasing filter bandwidth to the rise time of the pulse and affix the sensor on a rigid, flat, axially aligned base. Specifying a force transducer around nominal working load alone risks ruining the cell. Every specification must account for the static tare weight (tooling, platens and grippers), dynamic impact overshoot, and off-axis bending moments.
Mechanical mounting mistakes destroy accuracy long before a sensor reaches its overload limit. In Morehouse’s 2026 engineering guide on bad load cell setups, three field errors stand out. First, a compliant base plate can alter load distribution and the indicated force; time-dependent settling can cause drift under load, while plastic yielding can leave a residual zero shift after unloading. Second, thread reducers can introduce eccentric loading if their threads aren’t concentric; insufficient locking can lead to loosening under cyclic loads, while unsuitable material pairings or excessive tightening can cause galling or cracking. Third, rigid coupling without alignment buttons or spherical washers feeds lateral side loads straight into the primary bridge.
In order to safeguard multi-axis cells from accidental crashes, hardware designers incorporate mechanical gap stops into the assembly. A patent disclosure CN117309220B (published March 27, 2026; North China University of Water Resources and Electric Power) discloses a decoupled triaxial force sensor with defined mechanical clearances between the fixed and loading platforms and around the elastic branches. The sensor design background gives credit to earlier designs of overload protection shells (for instance, CN102519635B, disclosed by Xi’an Jiaotong University) which limit elastic element deflection under overload. In production equipment, a combination of mechanical stops with a fast cutoff controller allows stations to operate safely under harsh operating conditions.
The bandwidth of the signals being acquired is equally important. With high-speed metal forming, force and displacement sampling at rates of up to 10 kHz provides dense time-series points to capture fast transient signals accurately. Accurate capture of signal peaks requires the measurement chain to have sufficient bandwidth to pass the rise time of the edge of the sampled pulses. It’s critical to avoid digital overload. Match anti-aliasing filtering to the sampling rate (such as a configurable 0.1 to 2,000 Hz low-pass filter) and provide enough input range to avoid clipping. Controlled digital filtering also improves line efficiency by preventing false noise rejects. Prior to locking in the frame tonnage and sensor capacity, teams can run a quick check with our joining force envelope finder tool to get a rough idea of loads.
What Happens If a Force Measuring Instrument Is Overloaded?
Exceeding the safe overload limits can permanently deform the flexure or delaminate the adhesive on the strain gauges, resulting in irreversible zero shift or span error. Remove any overloaded transducer from service immediately for zero-balance verification and multi-point recalibration.
Force Calibration Standards and Error Control: ISO 376, ASTM E4, and Uncertainty

Metrology standards break force traceability into two tiers. The first tier involves calibrating the reference force-proving instrument. The second tier checks the installed testing machine on site. Confusing the two tiers results in quality audits being failed and tolerances on the shop-floor being unverified.
At the tier of the reference instrument, ISO 376:2011 (last reviewed and confirmed in 2026) governs the calibration of force-proving instruments for verifying uniaxial testing machines. It classifies reference transducers into Classes 00, 0.5, 1 and 2 based on creep, zero return, hysteresis and 0/120/240-degree axial rotation. In North America, ASTM E74 covers the calibration of force-measuring instruments and defines a Lower Limit Factor (LLF) from the statistical scatter of calibration data with respect to the calibration curve that has been fitted to the data. Because loading profiles and uncertainty equations differ, an ASTM E74 calibration cannot simply be used in place of an ISO 376 class certificate.
At the installed machine tier, ASTM E4-24 and ISO 7500-1:2018 (confirmed 2026, replacing the withdrawn 2015 edition) check force indication of the complete testing machine on site. Note an important metrological boundary in ASTM E4-24 Scope 1.6. While ASTM E4 specifies a typical allowable force indication error of +/-1% of the reading, it does not stipulate that uncertainty of calibration measurement be subtracted from this +/-1% tolerable limit. Consequently, in combination with the reference uncertainty, the true force indication may deviate from the ideal force by more than +/-1%. A NIST system calibration applies to the transducer and readout calibrated together; replacing the readout creates a new measurement chain whose traceability can be established through a new system calibration or compatible separate calibrations with a combined uncertainty assessment.
| Error Source or Standard | Physical Mechanism or Regulatory Scope | Impact on Measured Force | Engineering Control and Calibration Remedy |
|---|---|---|---|
| Nonlinearity | Flexure stiffness and bridge output deviate from an ideal straight line across full scale | Mid-scale readings systematically read high or low | Apply multi-point stepped calibration and polynomial curve linearization in the controller |
| Mechanical hysteresis | Ascending loading curve and descending unloading curve don’t overlap at the same force | Unloading or holding-release readings diverge from ramp-up values | Select low-hysteresis tool steel flexures and evaluate ascending/descending loops per ISO 376 |
| Creep and zero return | Time-dependent output change under constant load and residual offset after unloading | Reading drift during dwell holds and a non-zero baseline after unloading | ISO 376 addresses creep assessment of force-proving instruments; OIML R60 addresses creep assessment of weighing load cells |
| Off-axis and rotational error | Parasitic side loads, bending moments, or torque couple into the primary Wheatstone bridge | Identical axial loads produce different readings when the sensor is rotated | Perform 0/120/240-degree rotational calibration and install spherical load buttons or guide bushings |
| Thermal zero and span shift | Ambient or machine warm-up alters elastic modulus and cable copper resistance | Morning cold-start readings drift compared to afternoon warm production | Use temperature-compensated full bridges and 6-wire sense excitation feedback lines |
| EMI and cable noise | Servo drive PWM switching noise couples into millivolt bridge cables | False peak spikes and unstable tare baselines | Route double-shielded twisted-pair cables separately from motor power leads and set matched low-pass filtering |
| ISO 376:2011 / ASTM E74 | Calibration of reference force-proving transducers and proving rings in an accredited laboratory | Establishes reference instrument class (ISO 00/0.5/1/2) or ASTM E74 Lower Limit Factor | Calibrate reference cells at an accredited force calibration laboratory; don’t treat E74 and ISO 376 as interchangeable |
| ASTM E4-24 / ISO 7500-1:2018 | Force verification of testing machines | ASTM E4 addresses machine indication error without subtracting calibration uncertainty from the permissible error | ASTM E4 uses reference instruments calibrated under ASTM E74; ISO 7500-1 uses ISO 376 reference instruments |
| OIML R60 | Metrological regulation for legal-for-trade weighing load cells | Controls combined error envelope across temperature, humidity, and barometric pressure | Specify OIML R60 certified load cells for commercial batching, filling, and trade settlement scales |
How Often Should a Force Measuring Instrument Be Calibrated?
Periodic recalibration intervals are defined in accordance with the testing machine verification schedule in the facility quality system under ASTM E4-24 and ISO 7500-1:2018. High-cycle or safety-critical service can justify shorter calibration intervals and frequent check-standard tests; after an overload, damage assessment and measurement verification are needed before reuse, and a fixture change calls for verification of the new installed force chain before production results are accepted.
In-Process Force Measurement Applications in Press-Fit, Clinching, and Riveting
Electrification and lightweighting have turned force measurement from an offline laboratory check into a 100% inline production gate.
According to the IEA Global EV Outlook 2026 report on electric vehicle batteries, global EV battery deployment grew by almost 30% in 2025 to reach 1.2 TWh. Electric vehicles accounted for more than 70% of the total battery deployment in 2025. Battery packs, power modules, and vehicle body structures can have press-fit, clinched or self-piercing-riveted joints, and the integrity of such joints can impact electrical or structural performance.
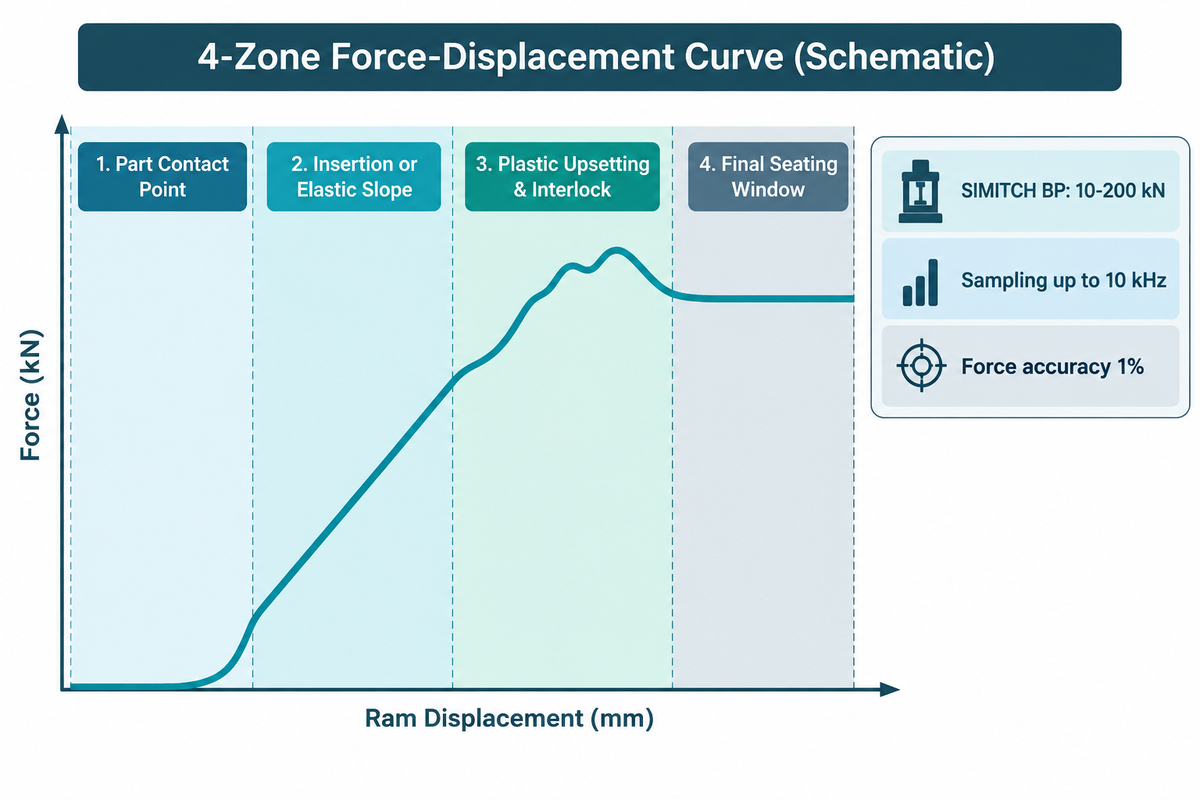
Some machine builders estimate pressing force from servo motor phase current to save the cost of a load cell. While motor current works for coarse crash protection, ball-screw friction, grease viscosity shifts during warm-up, and rotor acceleration inertia mask subtle joint defects. As Assembly Magazine’s engineering guide on evaluating press-fit curves explains, placing a direct load cell close to the tooling solves this problem. Plotting force against ram displacement exposes defects that peak-force checks miss.
On a force-displacement curve, engineers analyze four distinct zones to improve process capability and reduce scrap:
- Part contact point: Early force rise flags stacked double blanks or cocked parts. Late contact flags a missing component or undersized pin.
- Insertion or elastic slope: An abnormally steep or flat slope during press-fit interference assembly tolerances indicates out-of-spec shaft-hub interference, galling, or missing lubricant.
- Plastic upsetting and interlock formation: In pneumatic and servo clinching press control and self-piercing riveting curve defect checks, changes in curve slope can indicate deformation stages. Cross-sections of sample joints establish how those features correspond to die fill and interlock geometry.
- Final seating window: A force-and-position box at stroke end detects early jamming and is validated against correctly seated assemblies and representative seating defects.
Pneumatic and hydro-pneumatic presses can also be retrofitted with external load cells and encoder packages for pass/fail monitoring. Where programmable motion profiles and integrated curve analytics are required, servo press systems with force-displacement monitoring combine closed-loop ram control with high-speed data logging. SIMITCH’s published BP series specifications cover 6 models with a 300 mm standard stroke, 0.01 mm positioning repeatability, and 1% force measurement accuracy. The 380 V models include SMT-BP-10-300 (10 kN, 300 mm/s) and SMT-BP-30-300 (30 kN, 200 mm/s); confirm throat and height for the selected configuration. The range also includes SMT-BP-60-300 (60 kN, 200 mm/s). The 380 V models include SMT-BP-100-300 (100 kN, 160 mm/s) and SMT-BP-150-300 (150 kN, 110 mm/s); confirm throat and height for the selected configuration. The largest 380 V model is SMT-BP-200-300 (200 kN, 140 mm/s); confirm throat and height for the selected configuration.
To acquire high-speed curves, the SIMITCH BP Controller samples force and displacement at up to 10 kHz. It pairs this sample rate with a configurable 0.1-2,000 Hz low-pass filter and evaluates up to 4 independent window boxes per cycle. The controller stores up to 100,000 process records and 5 million curve points in on-board memory. External ports on the controller provide channels for force and displacement sensors. The controller supports PROFINET, EtherNet/IP, EtherCAT, CC-Link, Modbus and CANopen field buses. Even with 10 kHz direct load-cell sampling, moving ram and punch mass between the sensor and workpiece introduces inertial forces during rapid impact. Production cells must therefore qualify curve windows on actual fixtures alongside destructive cross-section or push-out testing.
Pricing and lead times for an equipment quote or sample tryout depend on the tooling and interface scope.
- Part drawings and material stack: Indicate shaft/hole tolerances, sheet thicknesses, surface coatings, and tempers of hardness.
- Target force and stroke envelope: State expected nominal pressing force, peak seating load, total stroke, and required throat depth.
- Gold and boundary fault samples: Provide nominal components as well as machined maximum and minimum tolerance samples, dry/unlubricated and burred samples to prove window limits.
- Sensor location and dynamic bandwidth: Define whether the internal ram load cell suffices or a secondary near-workpiece sensor is needed for low-force precision.
- Cycle time and data integration: Specify the target parts per minute, the PLC fieldbus protocol, and the MES advanced data retention requirements.
- In-situ verification procedure: Agree on the on-site force verification fixture and a periodic check-standard schedule referencing ASTM E4 or ISO 7500-1 methods.
Frequently Asked Questions About Force Measurement
Can Force Be Measured Directly, or Only Through Its Effects?
Force cannot be inspected visually like length. Every measurement compares an unknown push or pull against a reference balance or observes its physical effect on matter.
Primary metrology laboratories balance unknown loads directly against calibrated deadweight masses in a known gravity field to calibrate force transducers such as load cells and proving rings. Shop-floor instruments measure forces indirectly via calibrated physical responses. Strain-gauge load cells measure micro-strain of metal via a Wheatstone bridge, while piezoelectric sensors measure electrostatic charge on stressed quartz crystals.
Can a Digital Force Gauge Measure Both Push and Pull Forces?
Yes, almost all industrial handheld digital force gauges use bidirectional internal strain-gauge beams. They measure both compression (push) and tension (pull) along the main shaft.
The display shows polarity or direction icons, and many digital models offer peak-hold modes for tension and compression. Before performing bidirectional tests, make sure the correct flat compression platen or tensile hook is installed on the mounting stud. Avoid bottoming out the internal stop and verify that the calibration certificate covers both loading directions.
Do Scales and Balances Measure Force or Mass?
Spring scales and electronic load-cell platform scales respond to gravitational force; spring scales use calibrated graduations, while electronic scales convert sensor output into mass units through calibration.
Acceleration due to gravity varies by about 0.5% between the equator and the poles. Consequently, a load-cell scale calibrated in one city will read slightly off in another unless recalibrated on site. A mechanical dual-pan analytical balance evaluates an unknown object against reference masses in the same local gravity and thus measures true mass.
How Much Force Is 2 Newtons in Everyday Terms?
Under standard Earth gravity (9.80665 m/s²), 2 newtons equals the downward weight of a 204-gram object, or roughly 0.45 pound-force (lbf).
This is comparable to holding up a heavy modern smartphone in a protective case, or to holding two medium-sized apples in your hand.
Is Force Measured in Joules or Pascals?
Neither unit measures force. Force is measured in newtons (N), whereas joules measure energy or work and pascals measure pressure or mechanical stress.
One joule (1 J = 1 N·m) is the work done by one newton in moving a body one meter. One pascal (1 Pa = 1 N/m²) is one newton acting over one square meter.
How Do Engineers Measure Force of Impact vs. Static Load?
Engineers measure static and slow quasi-static loads with low-creep strain-gauge load cells. They switch to high-stiffness piezoelectric quartz sensors for millisecond impacts.
During a fast collision or high-speed punch, a compliant load cell rings at its mechanical resonant frequency and distorts the peak waveform. Quartz piezoelectric transducers have high stiffness and small deflection under load. The mass and stiffness of the assembled structure determine the mechanical resonance frequencies of the system, and the bandwidth of the amplifier and the anti-aliasing filter as well as the sampling rate, determine how accurately the electrical measurement captures the impact waveform. Engineers also account for the inertial force (mass times acceleration) of any fixture platen mounted between the sensor and the impact face. In drop towers, they multiply the known rigid-body mass by accelerometer traces.
Why Can Hydraulic or Pneumatic Line Pressure Misrepresent Actual Press Force?
A fluid pressure transducer inside a cylinder line only measures oil or air pressure (psi or bar). That reading yields theoretical thrust rather than net force at the workpiece.
As the piston strokes under load, dynamic lip-seal friction, guide-rod side binding, and exhaust back pressure all subtract force. Fluid viscosity shifts with temperature also alter resistance before the tool contacts the part. In Morehouse and Interface field studies, these unmeasured losses caused substantial drift between calculated p x A thrust and real joint load. Thus, critical interference fits, clinching stations and riveting cells place a strain-gauge or piezoelectric load cell in the mechanical load path near the tooling.
References & Sources
- National Institute of Standards and Technology (NIST): Calibration of Force Transducers (Deadweight Primary Standards & Voltage-Ratio Metrology)
- NIST Journal of Research (Vol. 110, No. 6): NIST Force Laboratory Strain-Gauge Excitation and Calibration Systems
- National Physical Laboratory (NPL, UK): National Physical Laboratory (NPL) guide to the SI unit of force
- International Organization for Standardization (ISO): ISO 376:2011 (Confirmed 2026), Calibration of Force-Proving Instruments
- International Organization for Standardization (ISO): ISO 7500-1:2018 (Confirmed 2026), Verification of Static Uniaxial Testing Machines
- ASTM International: ASTM E4-24, Standard Practices for Force Calibration and Verification of Testing Machines
- International Energy Agency (IEA): Global EV Outlook 2026, Electric Vehicle Batteries Deployment
- NASA Technical Reports Server (NTRS): NTRS 19950022058, Dynamic Impact Force Calculation and Boundary Analysis
- National Institutes of Health / PubMed Central: PMC9571206, Axial Strain-Gauge Load Cell Sensitivity and Bridge Design
- Ohio State University Spine Research Institute (Applied Ergonomics, 2020): Off-Axis Force Components in Manual Push-Pull Exertion
- HBK (Hottinger Brüel & Kjær): Piezoelectric or Strain-Gauge-Based Force Transducers Technical Comparison
- PCB Piezotronics: Introduction to Quartz Piezoelectric Force Sensors and Preload Rules
- Morehouse Instrument Company (2026): Bad Load Cell Setup: Mounting Base Hardness, Thread Reducers, and Alignment
- Interface Inc.: Distinctions of Measuring Force Versus Pressure
- Assembly Magazine: How to Evaluate a Press-Fit Force-Displacement Curve
- China National Intellectual Property Administration / Google Patents: CN117309220B (2026), Combined Decoupled Triaxial Force Sensor with Overload Gap Protection
Related Posts
Trending now




WHY WE WRITE THIS
About SIMITCH
SIMITCH develops sheet-metal joining equipment for clinching, riveting, servo pressing, pneumohydraulic drive and hot-melt connection applications. Our engineering team starts with the material stack, access envelope, cycle target and acceptance method before recommending a machine route.
Founded in 2006 in Taicang, Jiangsu, SIMITCH combines research and development, in-house production and global sales. These guides turn field experience into practical decision support for process engineers, plant teams and industrial buyers.
OUR EXPERIENCE
Since 2006
Equipment engineering, machining, assembly and joint validation under one manufacturing system.
OUR EXPERTISE
Five joining routes
Clinching, riveting, SPR, precision press-fit and hot-melt connection for production lines.