Get in touch with Suzhou Simitch Machinery Co., Ltd Company

Updated August 2026
The Precision Assembly Press BP Bending Type Series product page is the right destination for model, configuration, interface, and quotation questions. This guide serves a different job: helping quality and process engineers design force-displacement evidence, set bounded decision rules, and troubleshoot curve changes without mistaking a pass window for proof of every product characteristic.
A useful press curve isn’t merely a line inside an envelope. It’s a measurement record tied to one part family, tool, recipe, fixture, sensor chain, and confirmation method. Validation must show which physical event produced each feature, which defect the rule can detect, and where a separate product check remains necessary.
Short answer: Validate a BP assembly-press curve by segmenting it around real physical events, linking each rule to a defect mechanism, separating specification limits from acceptance and process-control limits, and confirming that the sensor, fixture, recipe, and data path remain stable.
Key takeaway
A passing curve supports only the characteristics that the validation study connected to that curve. It does not automatically certify the finished assembly, identify a unique failure cause, or transfer unchanged to another part variant.
Quick Reference
| Article role | Process validation and force-displacement curve interpretation |
| Commercial handoff | BP models, configuration, interfaces, comparisons, and quotation scope remain on the product page |
| Primary evidence | Physical events, qualified measurement chain, reference samples, defect challenges, and independent outcome checks |
| Not a substitute for | Product specifications, risk review, calibration scope, or downstream functional verification |
Precision Assembly Press BP Bending Type Series vs Press Brake: Fix the Search Confusion
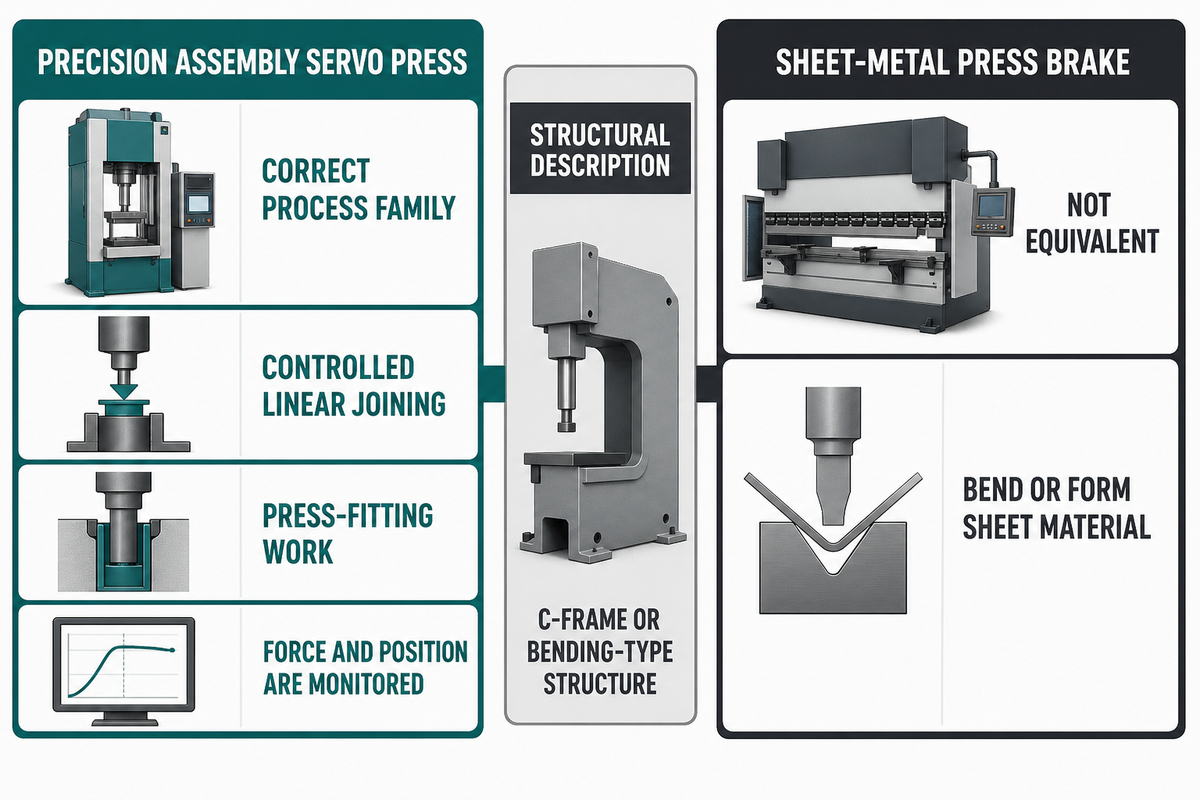
SIMITCH describes the BP Bending-Type Series as a precision assembly servo press for controlled linear joining and press-fitting work. A press brake belongs to a different process family: its tooling bends or forms sheet material. That product-family label doesn’t override the workpiece, tooling, and process purpose.
OSHA’s powered press-brake overview describes machines whose ram and bed use dies mainly to bend or form sheet metal. Drive technology is not a safe shortcut for classification. Official ISO 6909:2026 catalogue information includes servo-drive press-brake categories, so “servo” can appear in both families.
| Label | Relationship | Practical test |
|---|---|---|
| Precision assembly servo press | Correct process family | The controlled stroke joins, seats, inserts, crimps, or forms an assembly feature while force and position are monitored. |
| C-frame or bending-type structure | Structural description | The term describes machine arrangement; confirm the actual application and tooling. |
| Sheet-metal press brake | Not equivalent | The ram and dies bend or form sheet material along a line or profile. |
What types of operations are typically performed on assembly presses?
Assembly presses commonly seat bearings or bushings, insert pins, crimp parts, stake features, join interference-fit components, and verify a controlled pressing event. Applicable operations depend on tooling, materials, geometry, and the validated process. A press curve should describe the chosen operation rather than borrow terminology from an unrelated sheet-forming machine.
Segment the Curve by Physical Events Before Setting Any Rule
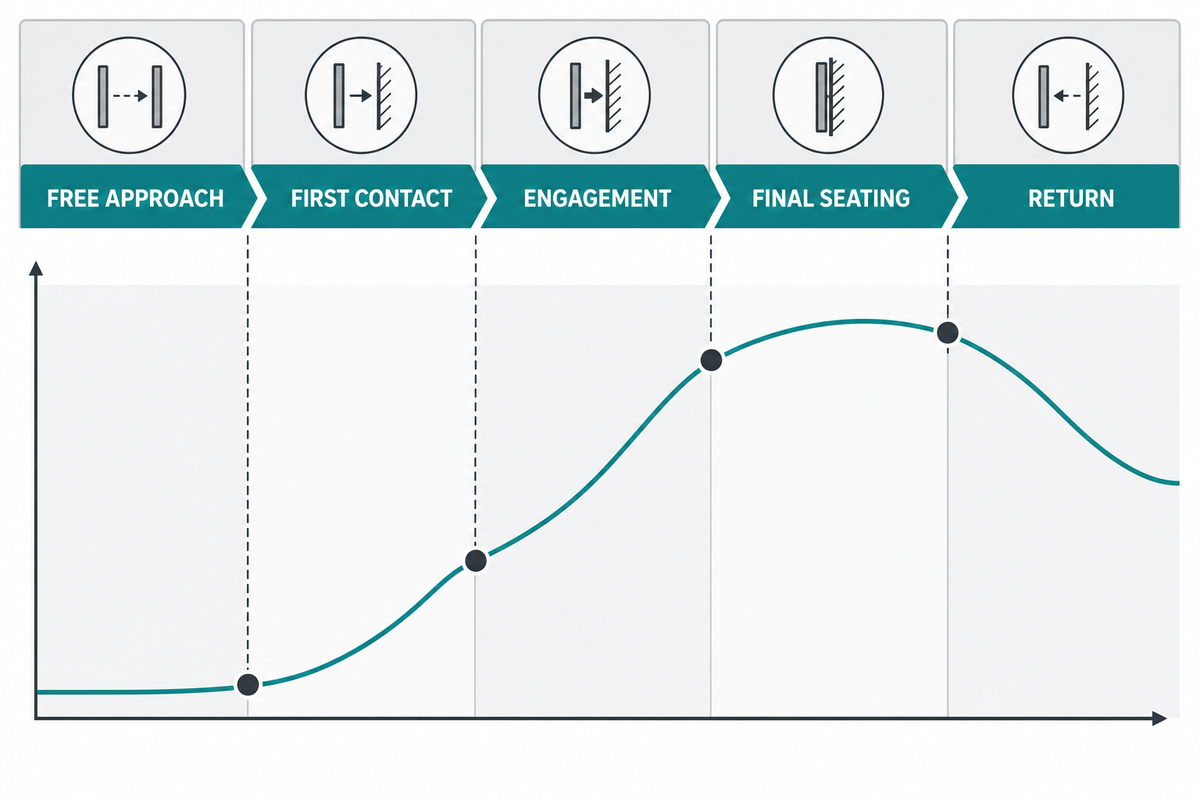
Curve segmentation should begin with the events that actually occur: free approach, first contact, engagement, working travel, seating, dwell, or return. Not every application needs all of those regions, and some operations contain additional transitions. Avoid forcing a standard four-window pattern onto every part.
The horizontal axis must use a declared displacement reference, and the vertical axis must identify the force signal and zeroing method. Record the sampling rate, filtering, coordinate direction, trigger, and any controller resampling. Otherwise, a later comparison may show data-system changes instead of process changes.
The trade-press curve examples show measured force-displacement and final-position features tied to particular assembly conditions. They support event-based interpretation, not a fixed region count for every process.
| Observed event | Curve evidence | Possible rule | Independent confirmation |
|---|---|---|---|
| Free approach | Near-baseline signal before contact | Unexpected pre-contact load | Clearance, part presence, cable and zero check |
| First contact | Repeatable force rise at a referenced position | Contact-position window | Part stack height and datum check |
| Engagement | Characteristic slope or event sequence | Slope, envelope, or force-at-position rule | Joint geometry, orientation, and material condition |
| Final seating | End position, peak, knee, or dwell response | Seat-position or final-force rule | Final dimension, retention, or functional test |
| Return | Unload or release behavior where recorded | Release or residual-force check | Tool release and part-damage inspection |
Illustrative example: suppose a known assembly reaches first contact near 25% of its qualified working travel, develops its main interference-fit signature between roughly 25% and 80%, and seats by the end reference. Those percentages are only a synthetic map for explaining the workflow. Engineers would replace them with physical datums from trial parts, then confirm contact, engagement, and seating with independent measurements.
How is quality verified during an assembly operation?
Quality is verified by demonstrating a stable relationship between curve features and the product characteristics that matter. That typically requires known-good parts, boundary conditions, representative defects, a controlled measurement chain, and an independent outcome check. A curve rule is released only for the evidence it has actually discriminated.
Start With the Defect Physics, Not a Convenient Number
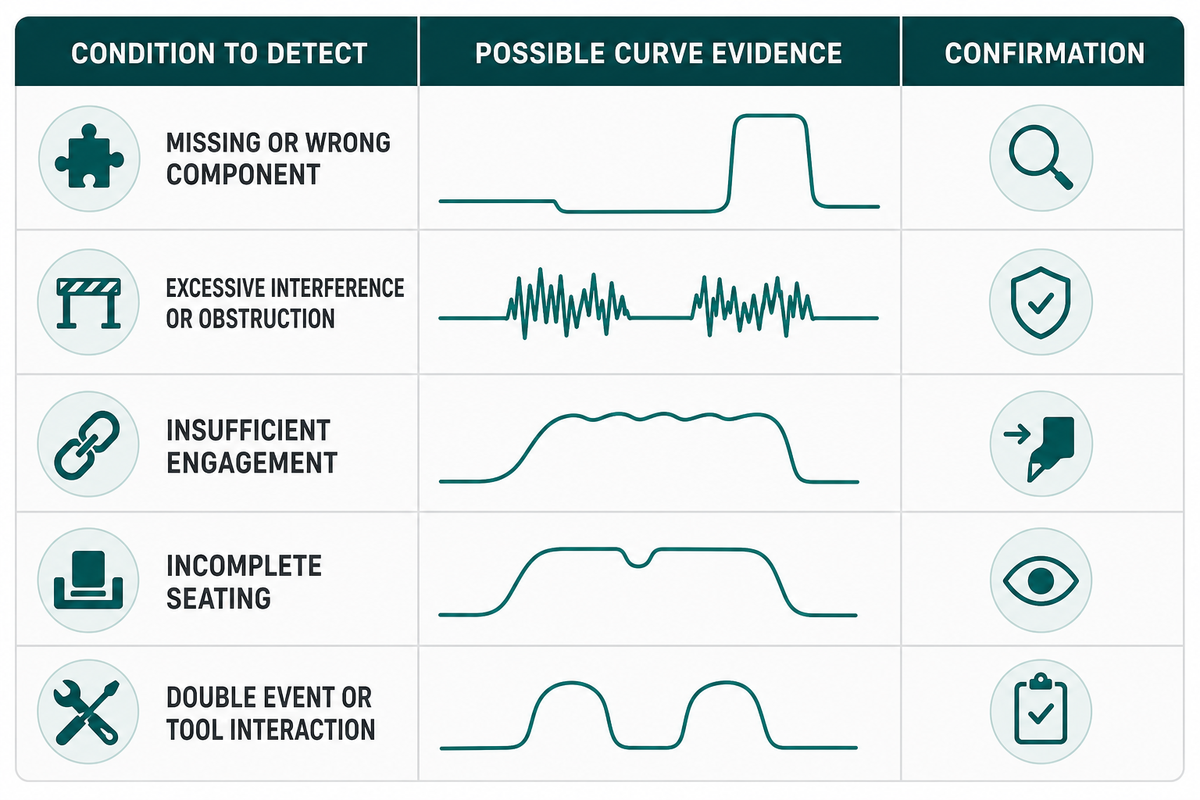
A monitoring rule earns its place by detecting a defined physical condition. “Peak force too high” isn’t yet a defect model. Excess force could reflect interference, material, lubrication, misalignment, a burr, a wrong component, fixture deflection, or a measurement error. Write the mechanism, expected signal, and confirmation method before choosing the rule.
Sector labels don’t determine a curve limit. Automotive, electronics, appliance, or aerospace context may change the product risk and confirmation plan, but the released rule still has to come from the actual part, process, measurement system, and decision.
An Assembly Magazine trade-press discussion of press-fit curves shows why force, displacement, final position, and the shape of the record can all matter. Its examples are useful, but the signatures aren’t universal acceptance rules for every assembly.
| Condition to detect | Possible curve evidence | Confirmation |
|---|---|---|
| Missing or wrong component | Missing event, early contact, or shifted seating point | Presence, identity, orientation, and stack-height check |
| Excessive interference or obstruction | High force, steep slope, overload, or premature stop | Part dimensions, material, burr, lubrication, and alignment |
| Insufficient engagement | Low force, shallow slope, or early seating | Joint geometry, retention, and dimensional result |
| Incomplete seating | Final position outside its validated relationship | Seat depth, gap, retention, or functional inspection |
| Double event or tool interaction | Extra peak, knee, or discontinuity | Tool marks, part damage, fixture motion, and event timing |
A 2026 peer-reviewed bushing study reports results for its own modeled geometry and explicitly leaves broader prediction to further verification. That’s the right boundary: a published force result is evidence for the tested system, not a hidden specification for the BP series.
Separate Specification, Acceptance, and Control Limits
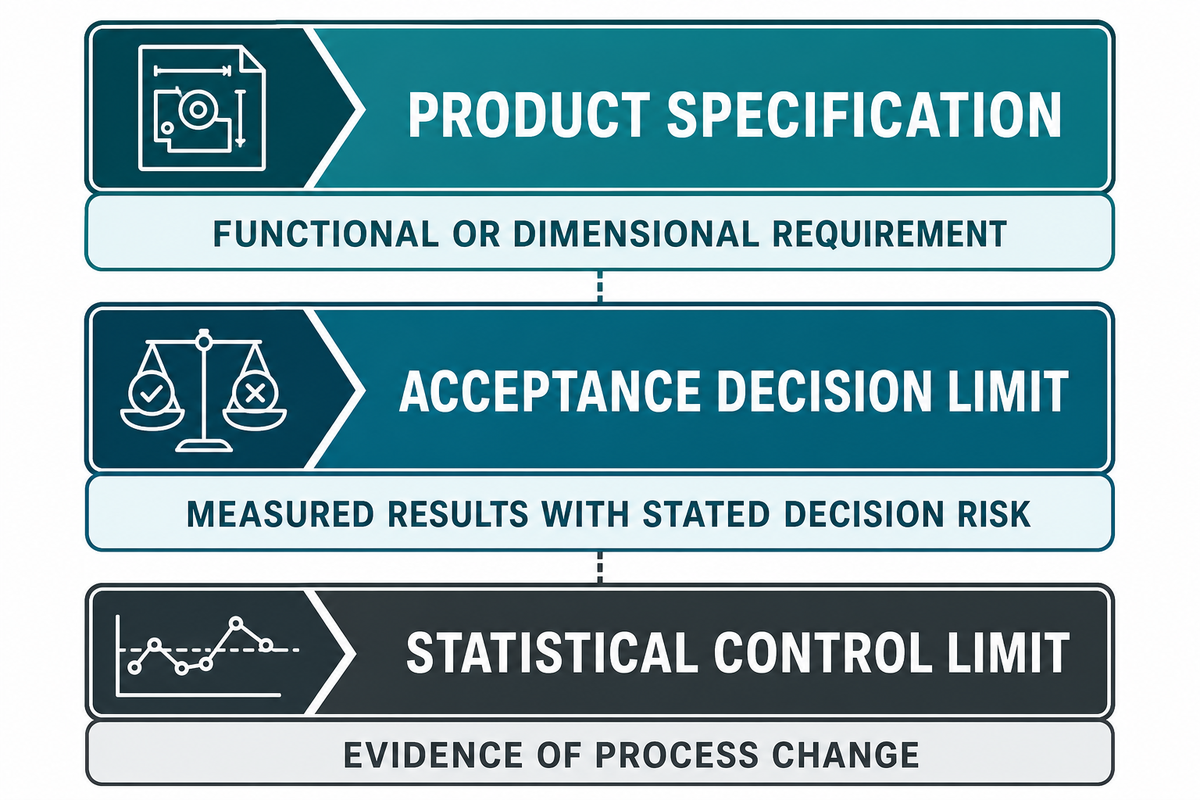
Three limit layers answer three different questions. A product specification defines acceptable function or geometry. An acceptance decision rule accounts for the measurement result and its uncertainty when deciding conformity. Statistical control limits indicate whether a stable process may have changed. One pair of curve lines shouldn’t silently perform all three jobs.
NIST’s metrological traceability guidance makes a related boundary clear: traceability alone doesn’t establish that a measurement result is fit for a particular purpose. Process owners must still define the measurand, uncertainty, decision risk, and process context.
| Layer | Question answered | Evidence source | Misuse to avoid |
|---|---|---|---|
| Specification limit | Will the finished assembly meet its functional or dimensional requirement? | Drawing, product requirement, validated engineering basis | Copying a process average into the product specification |
| Acceptance decision limit | How will measured results be judged with stated decision risk? | Measurement method, uncertainty, guard band, disposition rule | Treating calibration as automatic process acceptance |
| Statistical control limit | Does a stable process show evidence of change? | Stable, rationally subgrouped production data | Using control limits as product tolerances |
Rule selection follows the defect model. Force at a specified position may suit a known engagement event; position at a specified force may suit contact or seating behavior; a peak can capture overload; slope can describe stiffness change; an envelope can monitor a bounded shape; and an integral may summarize work over a qualified interval. Each rule also needs a failure mode it cannot reliably distinguish.
| Rule type | Best-matched question | Required basis | Limitations / Not suitable for |
|---|---|---|---|
| Force at position | Is resistance appropriate at a defined event? | Stable position datum and physical event | Weak when the event shifts legitimately in position |
| Position at force | Where does a defined resistance occur? | Qualified force signal and monotonic event | Weak when force crosses the threshold more than once |
| Peak force | Did the operation exceed a validated maximum? | Sampling that captures the peak | Does not explain where or why the peak occurred |
| Minimum force | Was sufficient resistance present in a region? | Qualified region and expected event | Can miss a short abnormal event outside the region |
| Slope | Did apparent stiffness or engagement rate change? | Defined interval, filter, and derivative method | Highly sensitive to noise and interval selection |
| Envelope | Did the qualified shape stay inside a bounded corridor? | Aligned curves and justified boundary construction | Can hide the cause and overfit the reference set |
| Area or integral | Did work over a defined interval change? | Stable baseline, interval, units, and sampling | Different shapes may produce similar totals |
| Final position | Did the process reach the qualified seat reference? | Stable datum and product relationship | Position alone does not prove joint integrity |
| Event order | Did required transitions occur in the correct sequence? | Reliable event definitions and timing logic | Not suitable when events cannot be separated reliably |
Illustrative calculation: assume a drawing permits seating-depth deviation within ±0.20 mm and the qualified measurement method has an expanded uncertainty of 0.03 mm at the decision point. A deliberately conservative rule might use a 0.03 mm guard band, producing an illustrative acceptance boundary of ±0.17 mm. This arithmetic isn’t a BP tolerance recommendation. Product specification still comes from the product requirement, and statistical control limits must come from stable process data rather than from ±0.17 mm.
The existing force-displacement window planning worksheet can help structure the inputs after the three limit layers have been separated.
Build a Stability-Monitored Reference Set
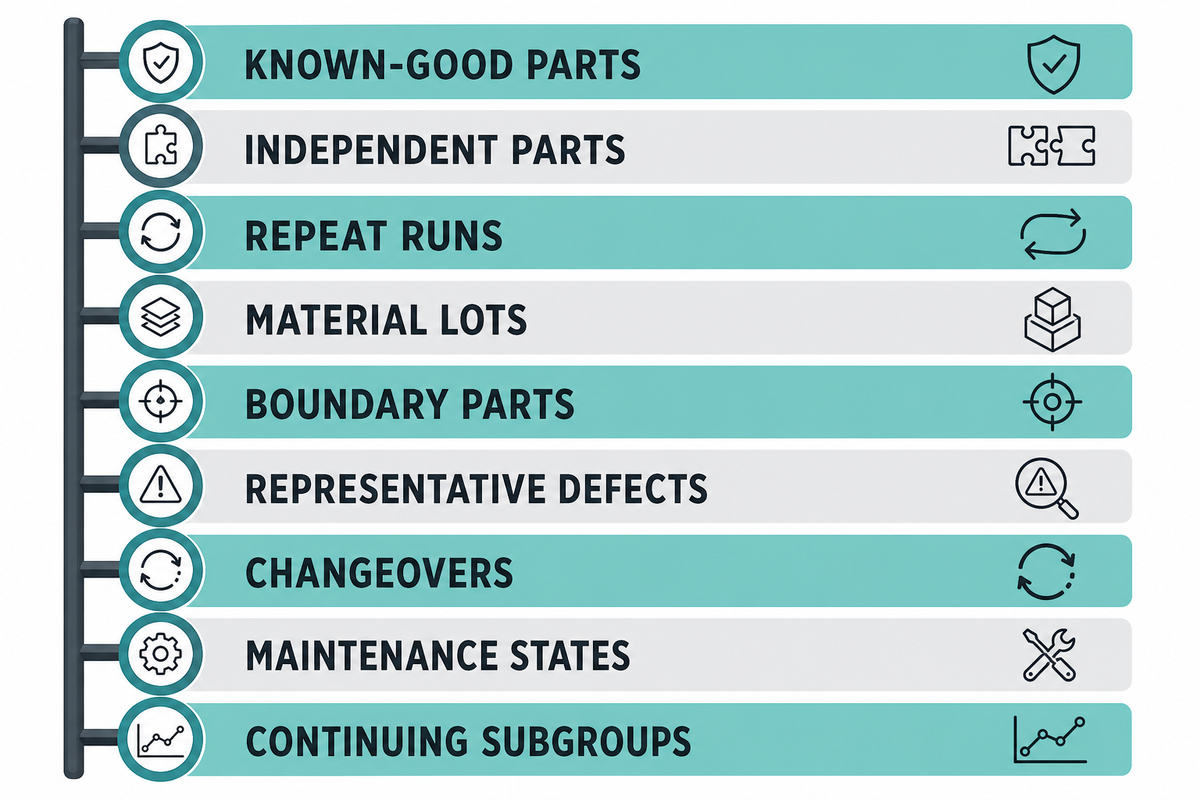
A reference set should represent the decisions the rule must make, not merely a handful of convenient golden parts. After specification, acceptance, and control limits are separated, this evidence supports each decision layer. Include known-good parts, expected sources of production variation, boundary conditions, and defect-representative samples where safe and feasible. Repeat runs are useful, but repeated cycles on one part aren’t equivalent to independent parts across lots and time.
The NIST sample-size handbook illustrates why a universal count is indefensible: different examples require different sample sizes when the parameter, variation, precision target, and decision objective change. Its example counts are statistical demonstrations, not assembly-press validation minimums.
| Evidence slice | Question | Exit criterion | Recheck trigger |
|---|---|---|---|
| Known-good parts | Is the expected signature repeatable? | Curve and independent outcome agree | Part revision or supplier change |
| Independent parts | Does the relationship survive part-to-part variation? | Decision risk meets the study objective | New variation source |
| Repeat runs | How much repeat variation comes from measurement and setup? | Repeat behavior is characterized and bounded | Sensor, fixture, or setup change |
| Material lots | Does expected material variation alter discrimination? | Qualified lots retain outcome agreement | Material or treatment change |
| Boundary parts | Does the rule behave near the product boundary? | Disposition remains correct near the boundary | Specification or decision-rule change |
| Representative defects | Can the rule detect the intended physical condition? | Defect sensitivity and escape risk are documented | New failure mode |
| Changeovers | Does setup recovery restore the approved relationship? | First-off checks and curve evidence agree | Tool or recipe family change |
| Maintenance states | Do service actions affect the signal path? | Post-service verification returns to the qualified state | Repair, relocation, or replacement |
| Continuing subgroups | Is the released process remaining statistically stable? | Owner reviews time-ordered data and outcomes | Unexplained shift, trend, or disagreement |
- First, define the decision. Name the defect or product characteristic, its independent confirmation method, and the consequence of a false accept or false reject.
- Next, qualify the measurement chain. Confirm the sensor, readout, displacement reference, fixture, sampling, filtering, and units before collecting the baseline.
- Then, capture independent production variation. Justify parts, lots, shifts, tools, warm-up states, and operators according to the actual process.
- Challenge the rule. Use boundary conditions and representative defects to test discrimination, not only repeatability on good parts.
- Monitor stability after release. Assign an owner, rational subgrouping logic, review frequency, and triggers for requalification.
Autocorrelated cycle data can create the appearance of more independent evidence than the team actually has. Preserve sequence and time stamps, distinguish repeated measurements from independent parts, and explain why each subgroup is rational for the process.
Audit the Sensor, Fixture, and Data Path Before Tightening Tolerances
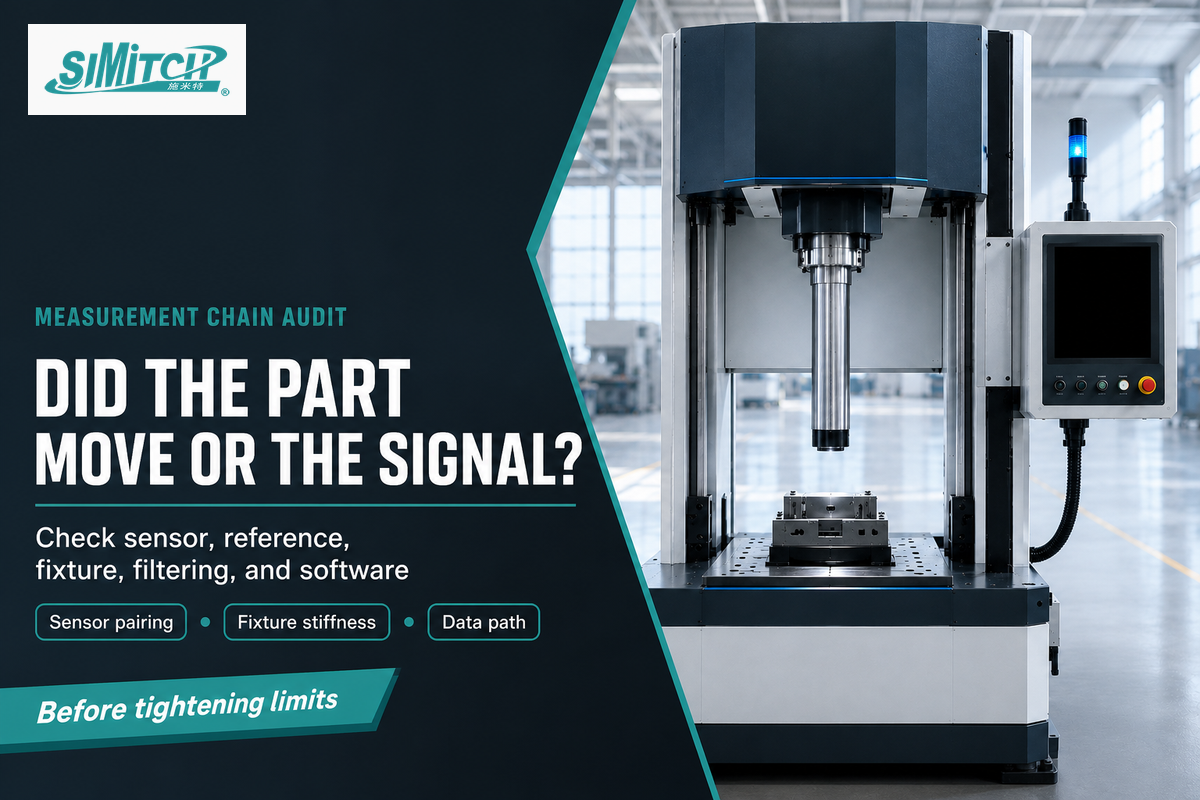
A shifted curve does not necessarily mean a shifted part. Possible sources include force calibration, readout configuration, displacement zero, fixture stiffness, alignment, electrical noise, sampling, filtering, unit conversion, software, or the time relationship between channels. Tightening limits before separating those effects can turn measurement noise into false rejects.
NIST’s force-transducer calibration program notes that a customer-supplied transducer and readout can be calibrated as a system and that the result applies to that pairing. It does not validate the installed press, fixture, software, or production recipe.
A curve can move because the process changed, because the measurement chain changed, or because both changed together. Preserve enough context to test all three explanations.
Do
- Record sensor, readout, fixture, software, filter, and unit versions.
- Check zero and reference position with a controlled method.
- Compare raw and processed signals when troubleshooting.
- Reconfirm alignment and fixture stiffness after maintenance.
Don’t
- Assume traceable calibration validates the production process.
- Change limits to hide unexplained drift.
- Compare curves with undocumented filter or sampling changes.
- Attribute every position shift to the part.
Scope discipline matters with standards. ISO 7500-1:2018 covers calibration and verification of force-measuring systems in static uniaxial testing machines. It can inform terminology and measurement thinking, but it is not a universal production-servo-press acceptance standard.
Use the Curve-to-Check Escalation Matrix
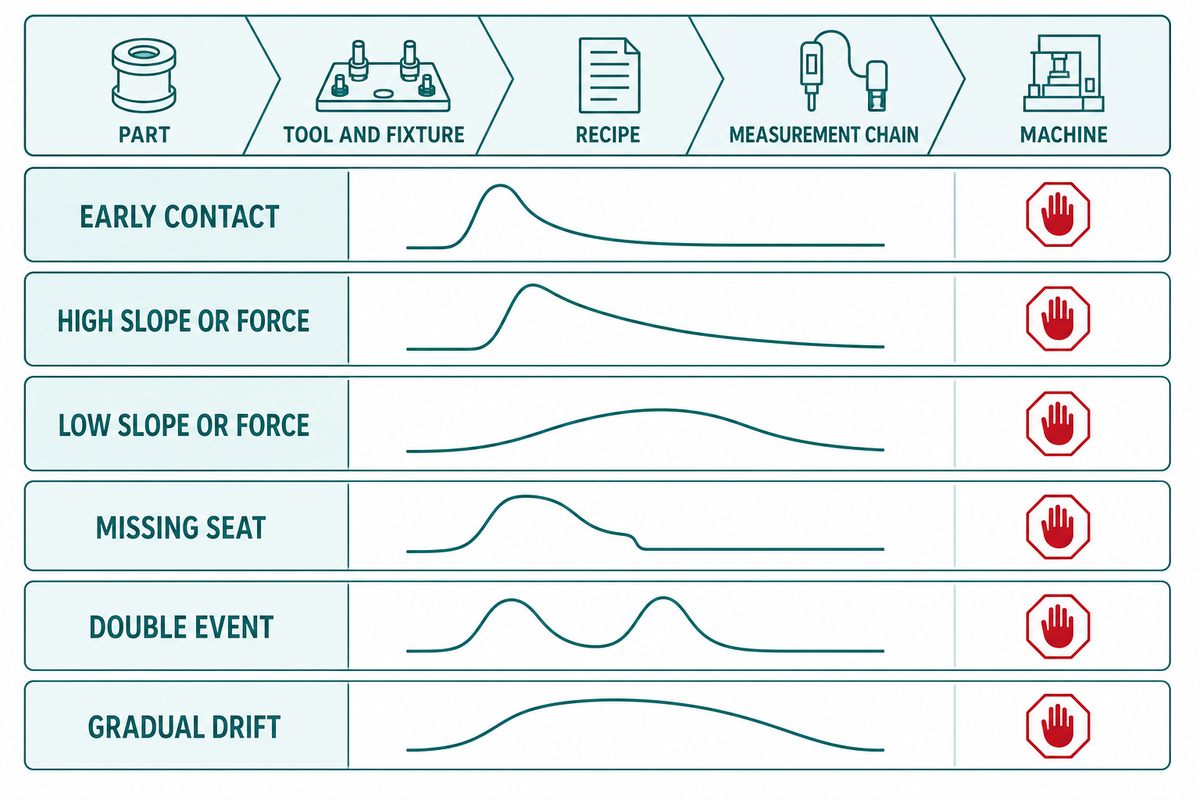
A curve excursion is an anomaly signal, not a root-cause verdict. Preserve the original record and then check the part, tool and fixture, recipe, measurement chain, and machine in a controlled order. Changing the limit first destroys evidence and may normalize a real process change.
NIST’s trustworthy smart-manufacturing research notes that transient events in automated sensing can appear as product defects. In a dated hydraulic-press practitioner discussion, contributors reported vibration, analog drift, and inconsistent scan timing as possible measurement effects. Those observations are diagnostic prompts, not BP-specific evidence or proof of a particular failure.
5-Check Curve Escalation Matrix
The 5-Check Curve Escalation Matrix tests part, tooling, recipe, measurement chain, and machine evidence before anyone changes a limit.
| Anomaly | First candidate checks | Independent confirmation | Stop condition |
|---|---|---|---|
| Early contact | Stack height, wrong part, debris, datum, zero | Part identity and dimensional check | Quarantine if product mix or obstruction is unresolved |
| High slope or force | Interference, material, lubrication, burr, alignment, fixture | Dimensions, material record, surface and tool inspection | Stop on overload, damage, or unverified material change |
| Low slope or force | Missing feature, low interference, wrong material, sensor span | Retention or functional test plus measurement-chain check | Hold if joint integrity is unconfirmed |
| Missing seat | Travel, obstruction, tool wear, recipe endpoint, reference shift | Final depth, gap, or functional measurement | Stop if the assembly cannot be confirmed complete |
| Double event | Tool interaction, part damage, fixture motion, duplicate feature | Visual, dimensional, and event-timing review | Hold until the second event is physically explained |
| Gradual drift | Lot, temperature, lubrication, wear, zero, filter, sensor and fixture | Time-ordered comparison with independent product checks | Revalidate after an unbounded recipe or measurement change |
Consider a line that develops a gradual position shift after fixture service while independent seat-depth checks remain unchanged. Curve evidence alone can’t decide whether the part, reference zero, alignment, or fixture stiffness moved. Controlled response starts by holding the original data, inspecting the service record, verifying the datum and fixture, and comparing a known reference part before editing the recipe.
The order is deliberately reversible: preserve the suspect curve, reproduce only under controlled conditions, make one documented change at a time, and compare both the curve and the independent product result. If the outcome check disagrees with the curve rule, the rule isn’t ready to make the release decision alone.
Prove the Recipe Across Lots, Shifts, Changeovers, and Maintenance
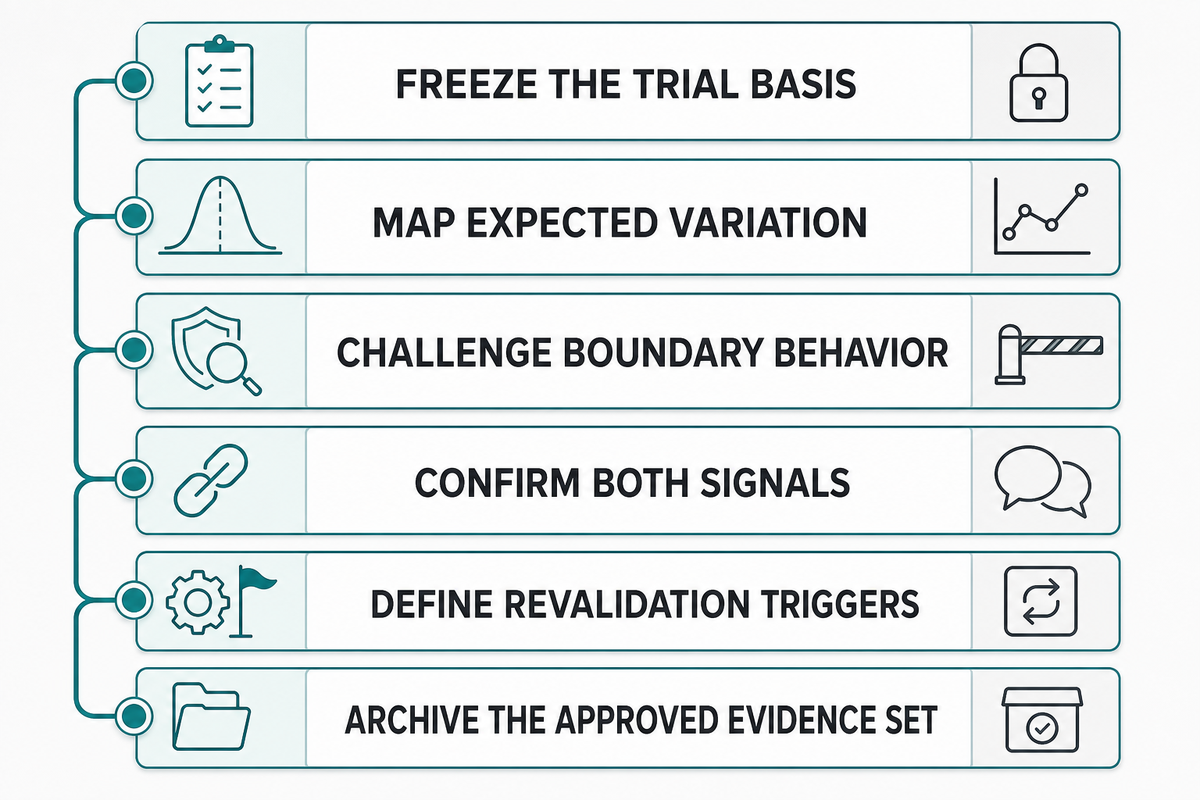
A recipe that works in a development trial still needs evidence across the variation expected in production. Useful challenge plans reflect actual material lots, component suppliers, operators, warm-up states, changeovers, tool service, fixture replacement, and environmental or timing conditions that can influence the assembly or measurement chain.
- Freeze the trial basis. Record part revision, material, tool, fixture, recipe, sensor chain, software, filter, and confirmation method.
- Map expected variation. Choose lots, shifts, operators, warm-up conditions, and maintenance states because they represent the real process, not because they fill a template.
- Challenge boundary behavior. Include qualified boundary conditions and representative defects where this is safe and technically meaningful.
- Confirm both signals. Compare the press curve with the independent product result and retain disagreements.
- Define revalidation triggers. Name the changes that require review, partial requalification, or a full new study.
- Finally, archive the approved evidence set, owners, and change history with the released recipe.
An Assembly Magazine case describing a Kistler, TEAM, and SKF high-mix line shows the practical role of recipes, sensors, and curve monitoring across many product variants. Its production figures belong to that case, not the BP series. Transferable value lies in controlling recipe selection and traceability when the mix changes.
Part-family grouping can reduce unnecessary recipes only when equivalence is demonstrated. If geometry, material, interference, datum, tooling, or confirmation behavior changes meaningfully, separate rules may be safer than a broad family envelope.
Imagine a new material lot that shifts engagement slope but continues to pass the independent retention and dimensional checks. Investigators shouldn’t immediately widen the slope band or reject the lot. They should verify material identity, measurement stability, and the qualified defect sensitivity, then decide whether the lot belongs to the existing process family or triggers a controlled revalidation.
Carry Evidence From FAT to SAT, Automation, and the Control Plan
Factory acceptance should prove more than cycle motion, and site acceptance should do more than repeat a demonstration. Effective handoff preserves the approved recipe, curve definitions, limit rationale, measurement-chain identity, alarm behavior, backup and restore method, deviation log, and revalidation triggers.
| Evidence | Factory acceptance | Site acceptance | Production owner |
|---|---|---|---|
| Recipe and version | Approved values, access rights, checksum or revision record | Installed version matches approved release | Process engineering |
| Curve rules | Event definitions, limits, rationale, trial evidence | Reconfirmed with site fixture and parts | Quality and process engineering |
| Measurement chain | Sensor, readout, displacement reference, filter, units | Installation, zero, alignment, data-path check | Metrology and maintenance |
| Alarms and interlocks | Cause, response, reset, bypass control | Integrated functional test | Controls and operations |
| Records and recovery | Curve retention, export, backup, restore demonstration | Network, time, user, and recovery verification | Information technology, operational technology, and quality |
Can assembly presses be automated without losing traceability?
Automation can preserve traceability when the system binds the correct recipe, part identity, curve record, result, time, user or machine state, and revision history. Control plans should define what happens when identity is missing, communication fails, data cannot be stored, or a recipe changes. A fully automated cycle without reliable context is only an automated motion record.
For broader equipment architecture, visit the servo press systems hub. Keep the project decision evidence separate from general product navigation so the released record remains auditable.
Related Engineering Resources
FAQ: BP Series Curve Validation
How does force-displacement monitoring verify assembly quality?
Force-displacement monitoring verifies only the assembly characteristics that a validation study has linked to defined curve features and an independent product result for the released process.
Validation must bind the part, tool, recipe, fixture, sensor chain, event definition, and independent product check. A stable in-window curve can then support the qualified relationship. It does not automatically prove all final dimensions, retention, sealing, electrical performance, or downstream function. Control plans should name both the released characteristics and the checks that remain outside the curve decision.
What curve features can indicate a bad press fit?
Early contact, unusual slope, missing seating, overload, an extra event, or gradual drift can indicate an abnormal press-fit state that needs physical confirmation before disposition.
Each feature has several possible causes. Investigators should check part identity and dimensions, material and lubrication, tool and fixture condition, recipe revision, sensor and displacement references, and machine behavior. A dimensional, retention, visual, or functional result is still needed to confirm the physical condition. Preserve the original curve, time order, and recipe version so the investigation does not erase the evidence it needs.
How should a team set initial force-displacement limits?
Initial limits should come from defect physics, qualified measurement behavior, independent samples, boundary conditions, and an explicit decision-risk review tied to outcome checks and approval.
Use known-good parts, expected production variation, defect-representative evidence where feasible, and repeat studies that distinguish within-part from between-part variation. Separate product specifications, acceptance decision limits, and statistical control limits. No universal sample count or percentage envelope can replace that evidence. Document who approves the rule, which outcome check validates it, and what change forces a new review.
Can one curve window work for every part variant?
One window can cover multiple variants only when the team has demonstrated equivalent event behavior, measurement response, defect discrimination, and acceptable decision risk for that process.
Meaningful changes in geometry, material, interference, datum, tooling, or confirmation behavior may require separate recipes or separately qualified part families. Grouping by a convenient product name is not enough; the evidence must show that the same rule still detects the same physical conditions with acceptable decision risk.
When should the servo-press measurement chain be rechecked?
Recheck the measurement chain after unexplained drift, repair, relocation, sensor or fixture replacement, and changes to sampling, filtering, units, software, reference settings, or channel timing.
Also review the chain after overload, alignment work, cable or readout changes, reference resets, controller replacement, backup restoration, and unexplained disagreement between the curve and independent product results. Rechecking should identify the sensor, readout, displacement reference, fixture, software, filter, units, and time relationship between channels. Reconfirm zero, alignment, data capture, and the independent product result before restoring the released rule. Compare the restored record with both a retained reference and a current independent outcome check; document any remaining shift instead of masking it with a new filter or wider limit. If the discrepancy persists, hold the affected product family and reopen the measurement-system and process investigation.
Does a passing press curve prove final product quality?
A passing press curve proves only the characteristics covered by the validated relationship; other product functions may still require independent inspection or testing for release.
Final dimensions, retention, sealing, electrical performance, material integrity, or other functions may still need separate checks. Control plans should state which characteristics the curve releases and which remain downstream inspections. If a product result and curve disagree, investigate the relationship rather than accepting whichever signal is more convenient.
References & Sources
- Calibration of Force Transducers — National Institute of Standards and Technology
- Metrological Traceability — National Institute of Standards and Technology
- Trustworthy Systems, Components, and Data — National Institute of Standards and Technology
- Sample Sizes Required — NIST/SEMATECH Engineering Statistics Handbook
- Powered Press Brakes — Occupational Safety and Health Administration
- ISO 6909:2026 — International Organization for Standardization
- ISO 7500-1:2018 — International Organization for Standardization
- Bushing interference-fit study — Applied Sciences
Why This Guide Is Narrowly Scoped
The validation guide was prepared from the cited public metrology, standards, research, and industrial sources, with the SIMITCH product page used to identify the BP product family and define the commercial handoff. It intentionally excludes model tables, catalogue specifications, pricing, and supplier comparisons. Published under the WordPress author CYH for Suzhou Simitch Machinery Co., Ltd.
Plan a BP Curve-Validation Trial
Bring the part drawing, defect list, confirmation method, expected production variation, and current measurement-chain details. SIMITCH can use that scope to discuss an application trial without turning an illustrative window into a catalogue promise.